Gain deeper insights into your data with Tabulate's powerful visualization tools. No coding required, just craft charts that reveal.
Build insightful charts and graphs through a simple drag-and-drop interface. Easily drag columns onto axes X and Y to define what you want to analyze, and apply filters by dragging relevant fields into the filter area. It’s intuitive, allowing you to manipulate and explore your data effortlessly.
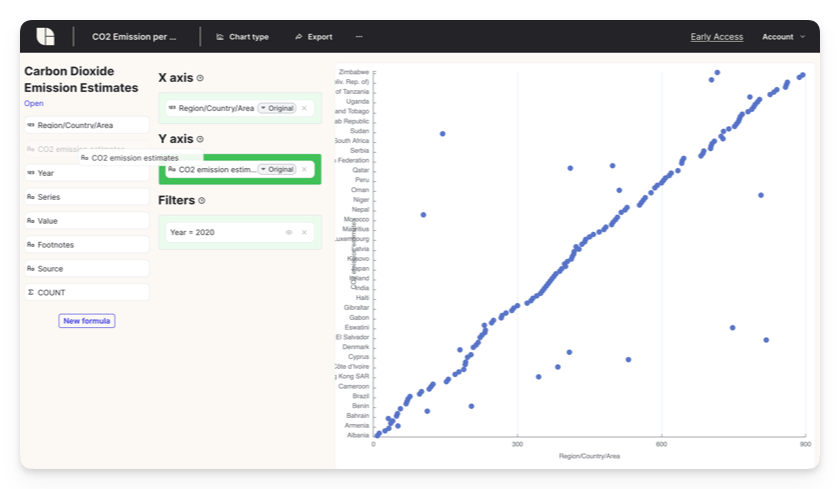
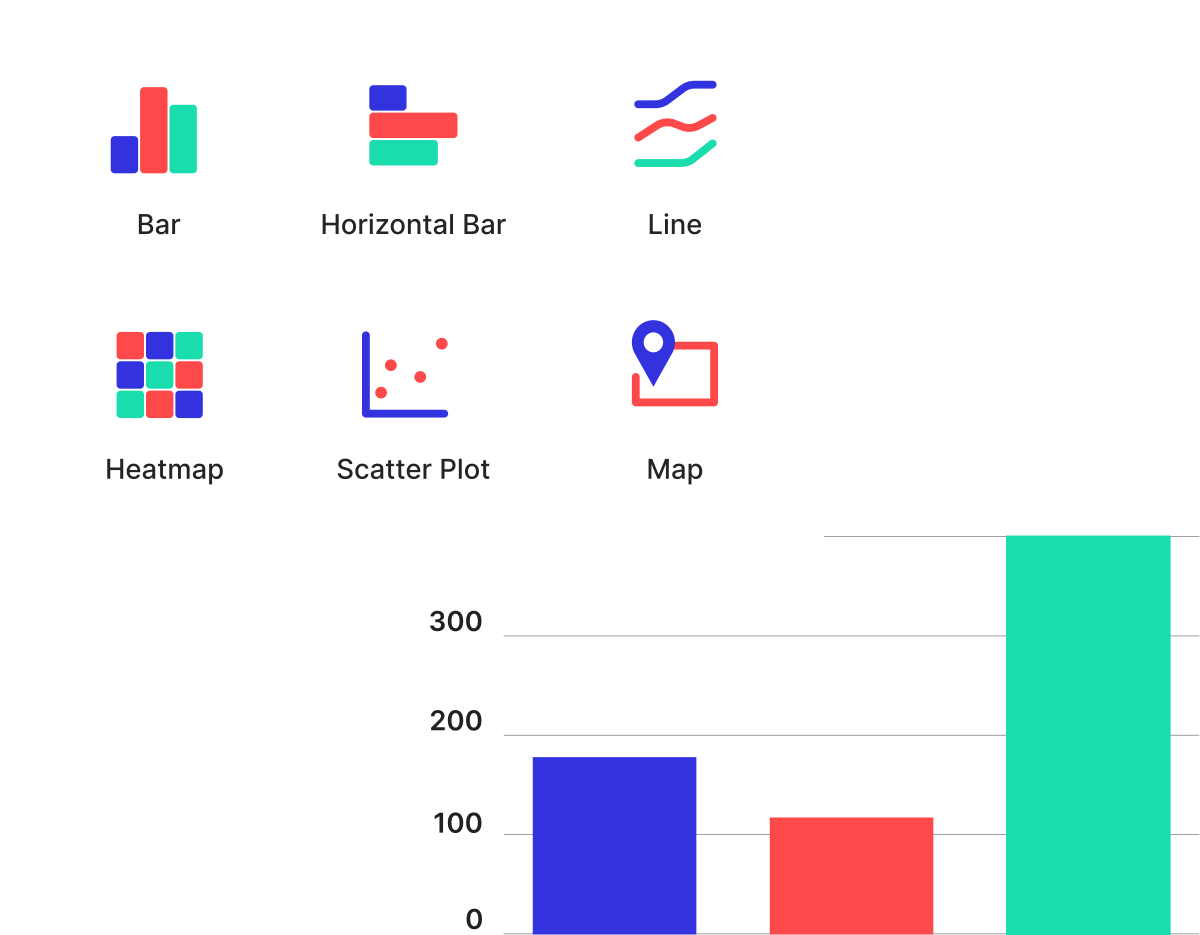
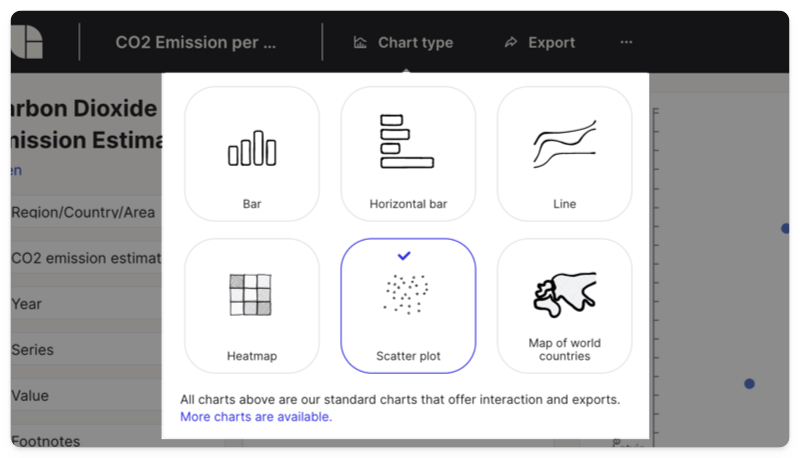
Leverage a variety of visualization options like bar, line, and scatter plots. Choose the chart type that best fits your analysis needs with just a few clicks.
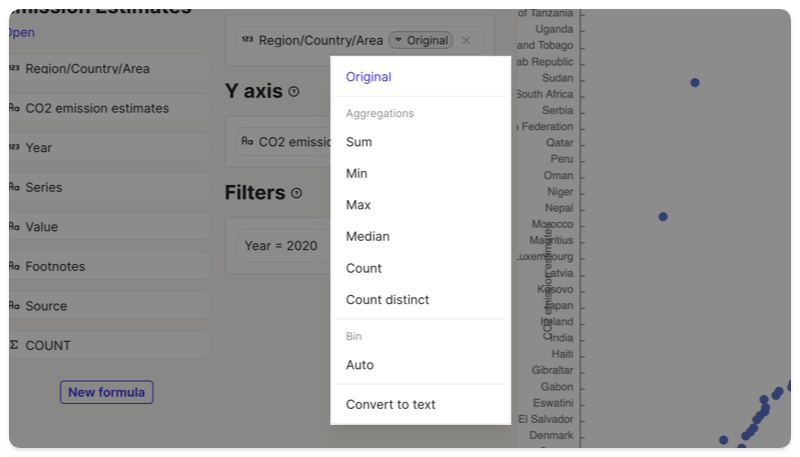
Easily transform data directly within your charts with helpers for common tasks like changing data types, and performing simple aggregations such as sums or averages. All available through an intuitive interface.
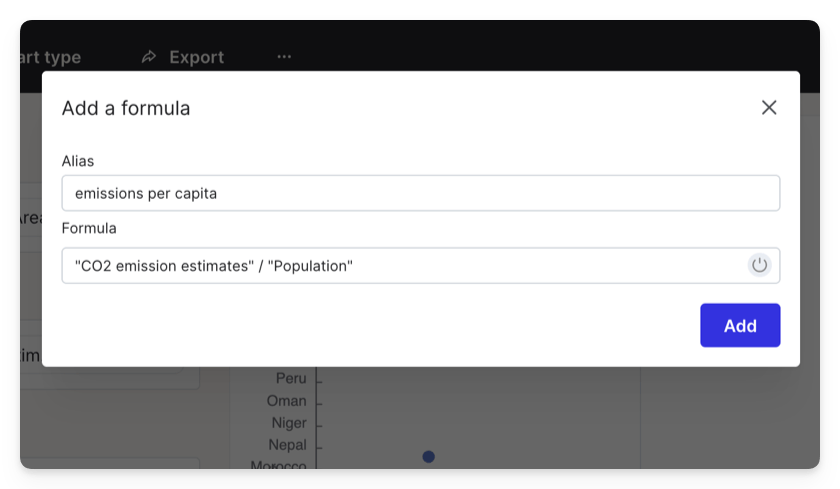
Apply formulas directly within your visualizations to compute values dynamically. Enhance your data analysis without stepping outside the visualization platform.
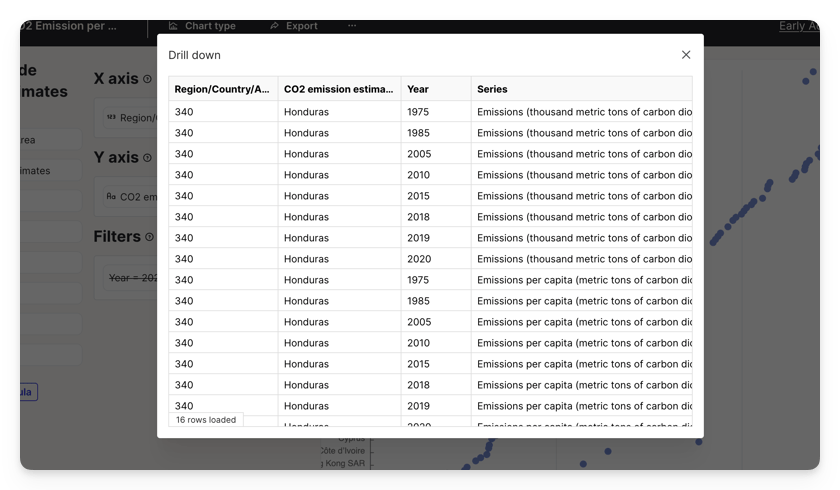
Get the data behind the numbers. Click on any part of your chart to drill down into more detailed data layers, uncovering more specific insights as needed.
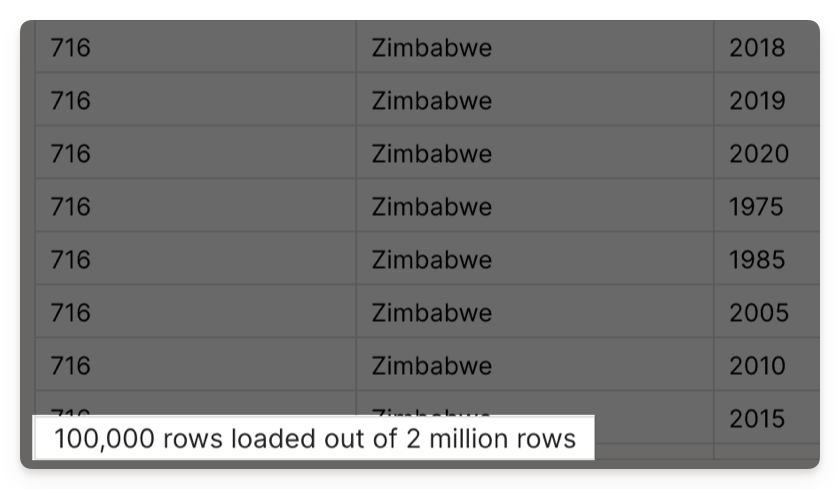
Confidently work with large datasets, including millions of rows. Tabulate's visualization tools are built to handle substantial data volumes without compromising performance.
Walk through how to leverage Tabulate’s visualization tools to uncover and understand patterns, trends, and relationships in your data. Intuitive and powerful, these features make data exploration a breeze.